A guide on seasonal products
Introduction
For more info on service levels, read this guide.
Jenny Example sells seasonal products. She wants to know how much safely stock she should store. Her best sellers require more safety stock and she is less concerned about overselling those items, since they sell so quickly. For other items, she is concerned about overstock. She could be sitting on a 2 year supply of a product that rarely sells. This will tie up her capital and increase her storage fees.
Solution
She needs a report of the total revenue and sales per product. She needs to calculate the service level of products. Lokad defines service level as "The service level expresses the probability that a certain level of safety stock will not lead to stock-out. Naturally, when safety stocks are increased, the service level increases as well. When safety stocks get very large, the service level tends toward 100% (i.e. zero probability of encountering stock-out)."
The higher the service level, the more safety stock she should store. She decides to add a class to her products:
| Class | Notes |
| AX | Good for products that sell the same number of units per month. These SKUs generate high revenue and experience low variance. As such, a supply chain practitioner might decide that lower levels of safety stock are needed than the other A-class SKUs, in order to achieve high service level targets. |
| AZ | Good for seasonal, popular products. If you sold turkeys, your sales would increase during the holidays and slow down the rest of the year. These SKUs may generate equally high revenue as AX and AY ones, but experience significantly more demand variance. As a result, higher levels of safety stock might be deemed prudent. |
| CX | These SKUs not only generate low profit, but experience elevated levels of demand variance. From a supply chain perspective, these SKUs represent the worst of both worlds. Such SKUs would, theoretically, have low safety stock levels and be prime candidates for possible discontinuation. |
| CZ | These SKUs not only generate low profit, but experience elevated levels of demand variance. From a supply chain perspective, these SKUs represent the worst of both worlds. Such SKUs would, theoretically, have low safety stock levels and be prime candidates for possible discontinuation. |
Here is a diagram of the classes:

What fields are included?
Here is a list:
- Product name
- Total revenue per month Jan - Dec.
- Cumulative revenue. How much each product makes per year
- Variance: Difference in revenue per month
What is XYZ class?
X class products are the most stable and Z products have the most variance. Your safety stock of Z products should be higher than your safety stock of X products.
What is the ABC class?
Your A products sell more units then your C products. Your A products represent the top 50% of your sales. The top 85% are represented by A plus B products. Your bottom 15% are your C products.
What are the cons of the report?
The report assumes a product's value is total revenue. Having a low selling product may facilitate the sale of other products.
As you move from Jan. to Dec., your SKU requires more safety stock. The problems with this approach is if your products trend in opposite directions. Both Harry Potter and Tesla t-shirts finished as BY-class SKUs and would receive the same service level and safety stock targets. This ignores the fact that the SKUs are demonstrably trending in completely opposite directions.

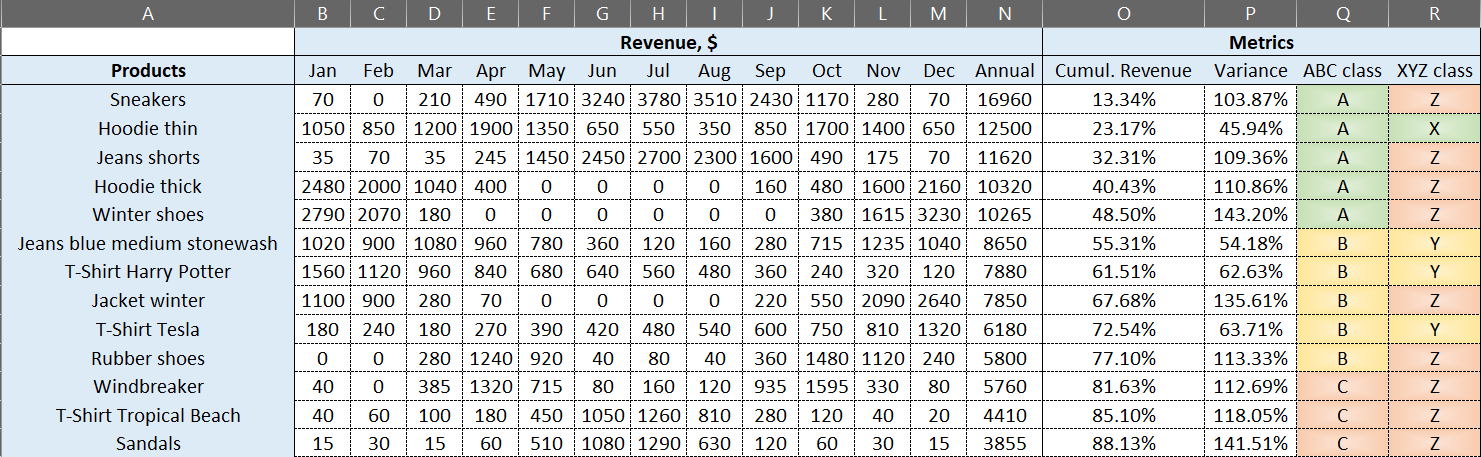
What does the data look like?
Here is a spreadsheet. Here is sample data: